Histogram Series
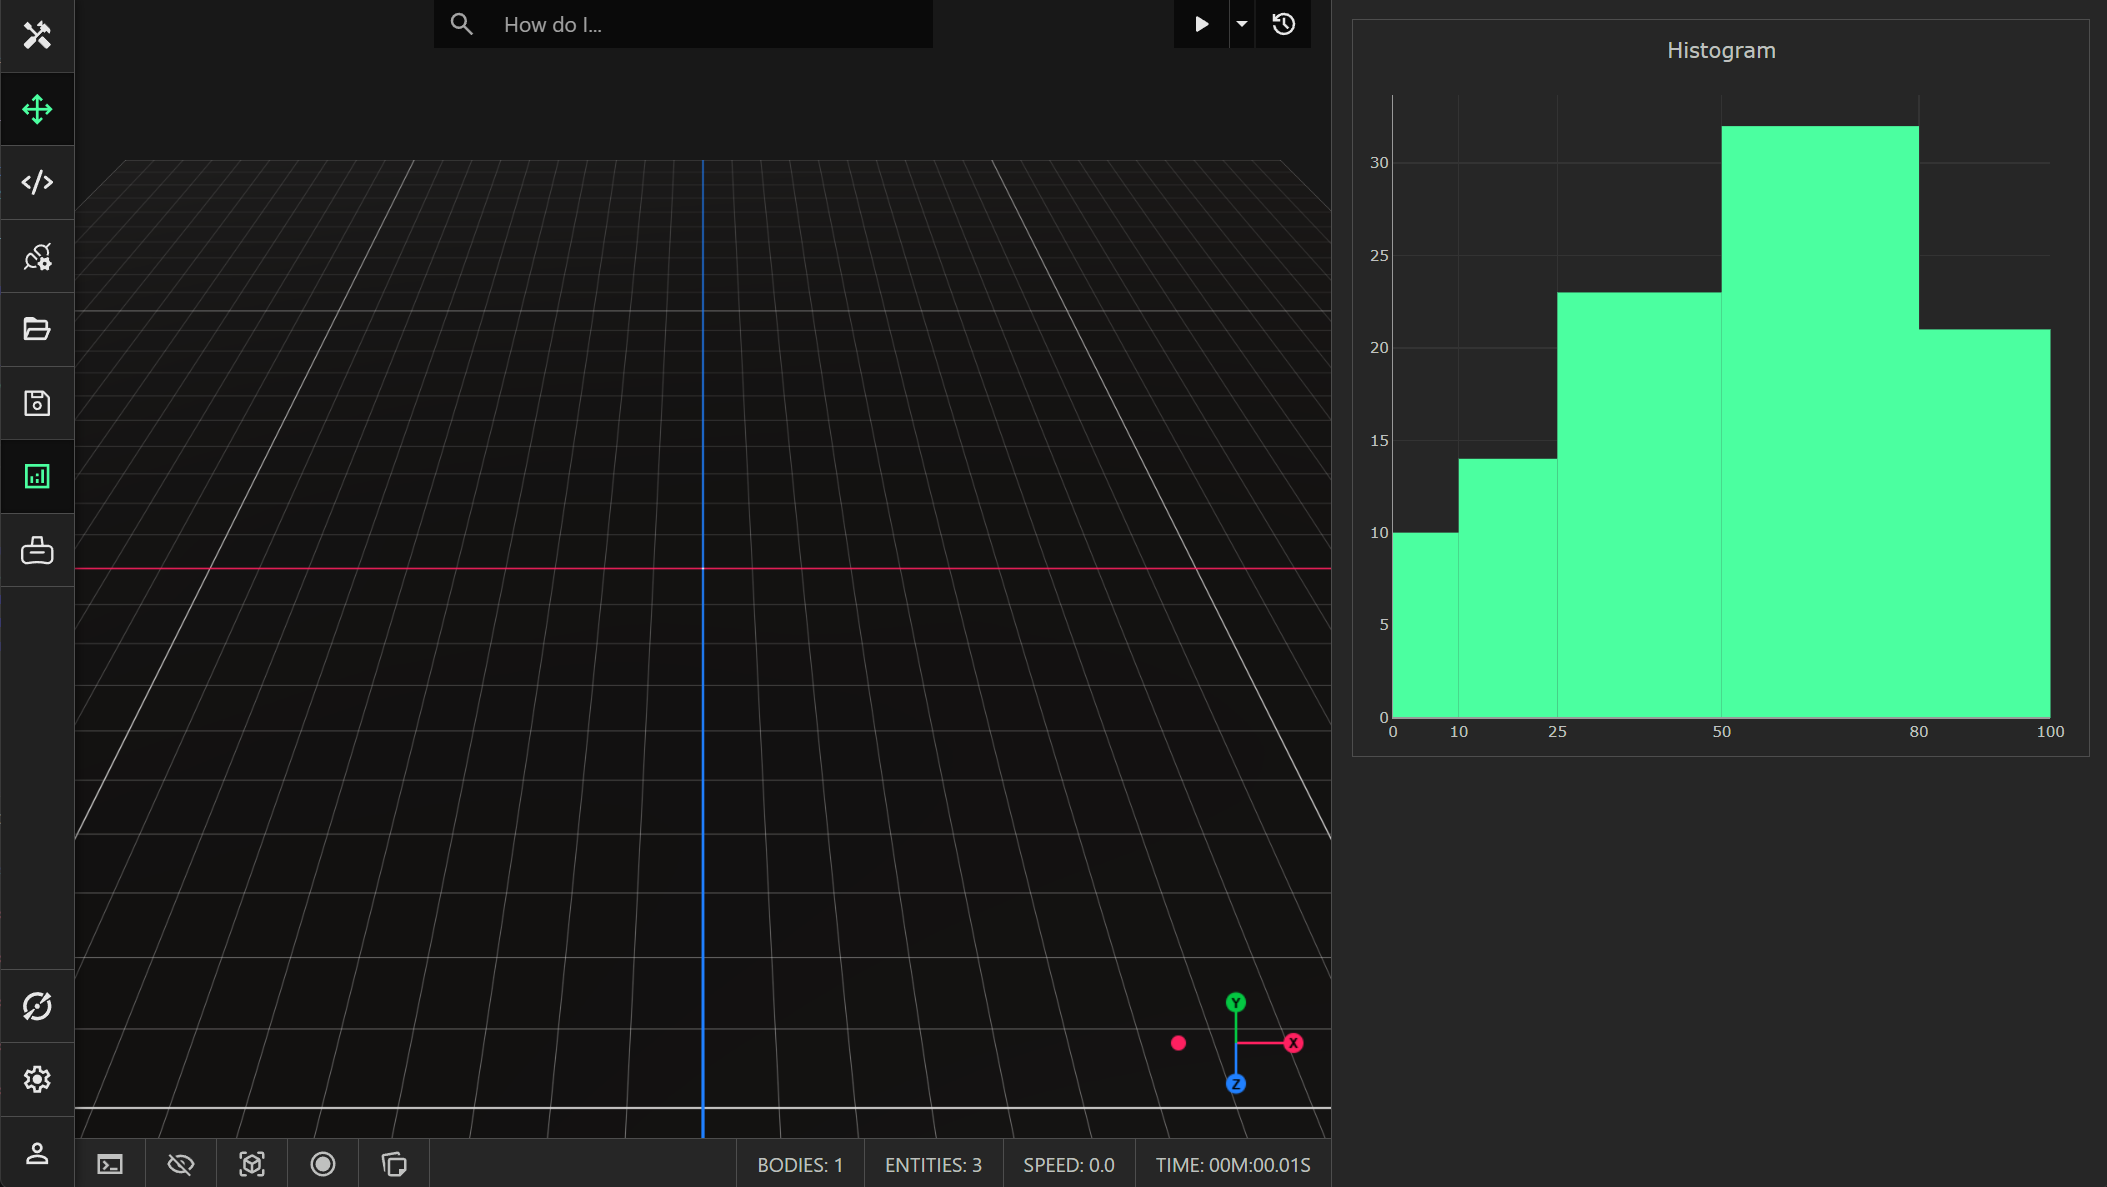
The Histogram Series is a type of plot that shows the frequency of numerical data points that fall within defined ranges. A minimal example is provided below that generates 100 random numbers between 0 and 100 and groups the values into intervals defined by the 5 bins:
import { type Entity, Component, Analysis, HistogramSeries, Random } from "prototwin";

export class Graph extends Component {
    #histogramSeries: HistogramSeries;

    constructor(entity: Entity) {
        super(entity);
        this.#histogramSeries = new HistogramSeries(); // Create the series.
    }

    public override initialize() {
        // Create the plot and add the series to it.
        const plot = Analysis.plots.add("histogram", "Histogram");
        if (plot !== null) {
            plot.add(this.#histogramSeries);
        }

        // Create the bins and values.
        const bins = [0, 10, 25, 50, 80, 100];
        const values = [];
        for (let i = 0; i < 100; ++i) {
            values.push(Random.global.nextNumber() * 100);
        }

        this.#histogramSeries.clear();
        this.#histogramSeries.create(values, bins);
    }
}