Analysis Introduction
The scripting API provides the necessary tools for plotting and analyzing data collected during the simulation. Please see the following API Documentation pages for further details:
Data Collection
Start by creating a scripted component and add it to the entity. This entity can either be the one you would like to collect data from, using this.entity, or from a different entity in the digital world. To record data from a different entity, we recommend using a handle:
export class Graph extends Component {
    public ball: Handle<Entity>;

    public constructor(entity: Entity) {
        super(entity);
        this.ball = this.handle(Entity);
    }
}
You can also query the world:
export class Graph extends Component {
    #ball: Entity|null;

    public constructor(entity: Entity) {
        super(entity);
        this.#ball = null;
    }

    public override initialize(): void {
        this.#ball = this.world.find("Ball");
    }
}
With a public handle, you can search for and select the desired entity for your custom scripted component through the inspector. If you want to query the world and there are multiple entities named “Ball”, please note that find() will only return the first entity that was found.
Example
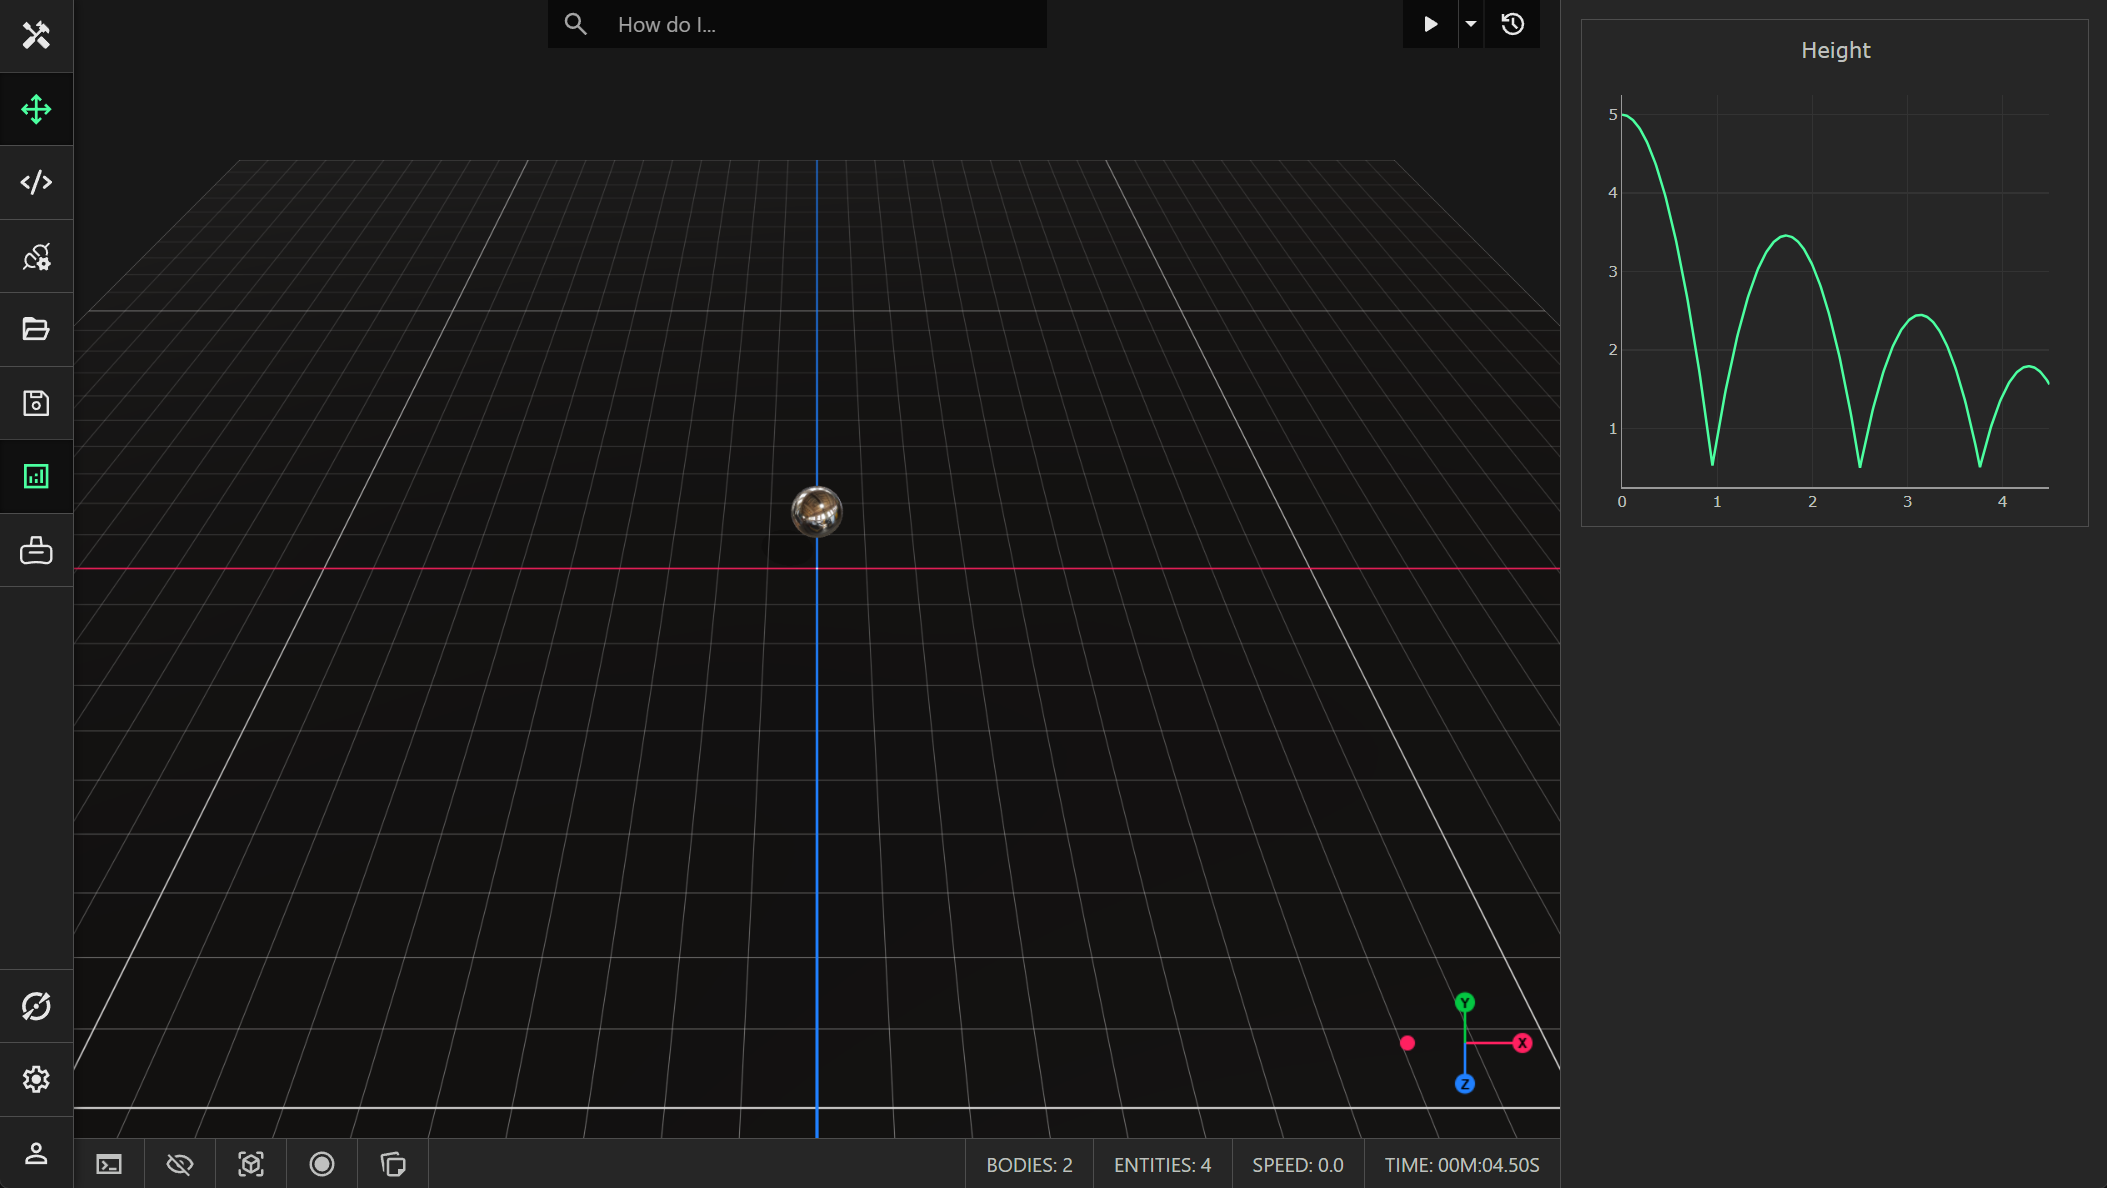
In this example, we demonstrate how to plot the height of a ball that bounces over time. Both the ball and the floor are assigned a custom physics material that have a non-zero coefficient of restitution.
The complete code for this scripted component is provided below:
import { type Entity, Component, LineSeries, Analysis } from "prototwin";

export class Graph extends Component {
    #lineSeries: LineSeries;

    constructor(entity: Entity) {
        super(entity);
        this.#lineSeries = new LineSeries();
    }

    public override update(dt: number): void {
        this.#lineSeries.add(this.world.time, this.entity.position.y); // Add a data point (x, y) to the series.
    }

    public override initialize(): void {
        const plot = Analysis.plots.add("graph", "Height"); // Create a new plot with the unique name "graph".
        if (plot !== null) {
            plot.add(this.#lineSeries); // Add a series to the plot.
        }
    }
}
This component records the y-axis position of the entity to which it is attached every timestep. When adding a plot, using Analysis.plots.add(), the first argument specifies the unique name for the plot. The second (optional) argument specifies the title of the plot. This function will return the created plot, or null if the name is not unique.
You can add multiple series to a plot (see the line series example). In this example, we just add a single line series, connecting each data point using a straight line. We override the update() function on the component to add a new data point every timestep.
Analysis Pane
You can view all the plots by toggling the analysis pane through the toolbar. The analysis pane is resizable by dragging the left edge. Each plot can be saved to an image. You can also export the data from each plot to a CSV file.