Infobar
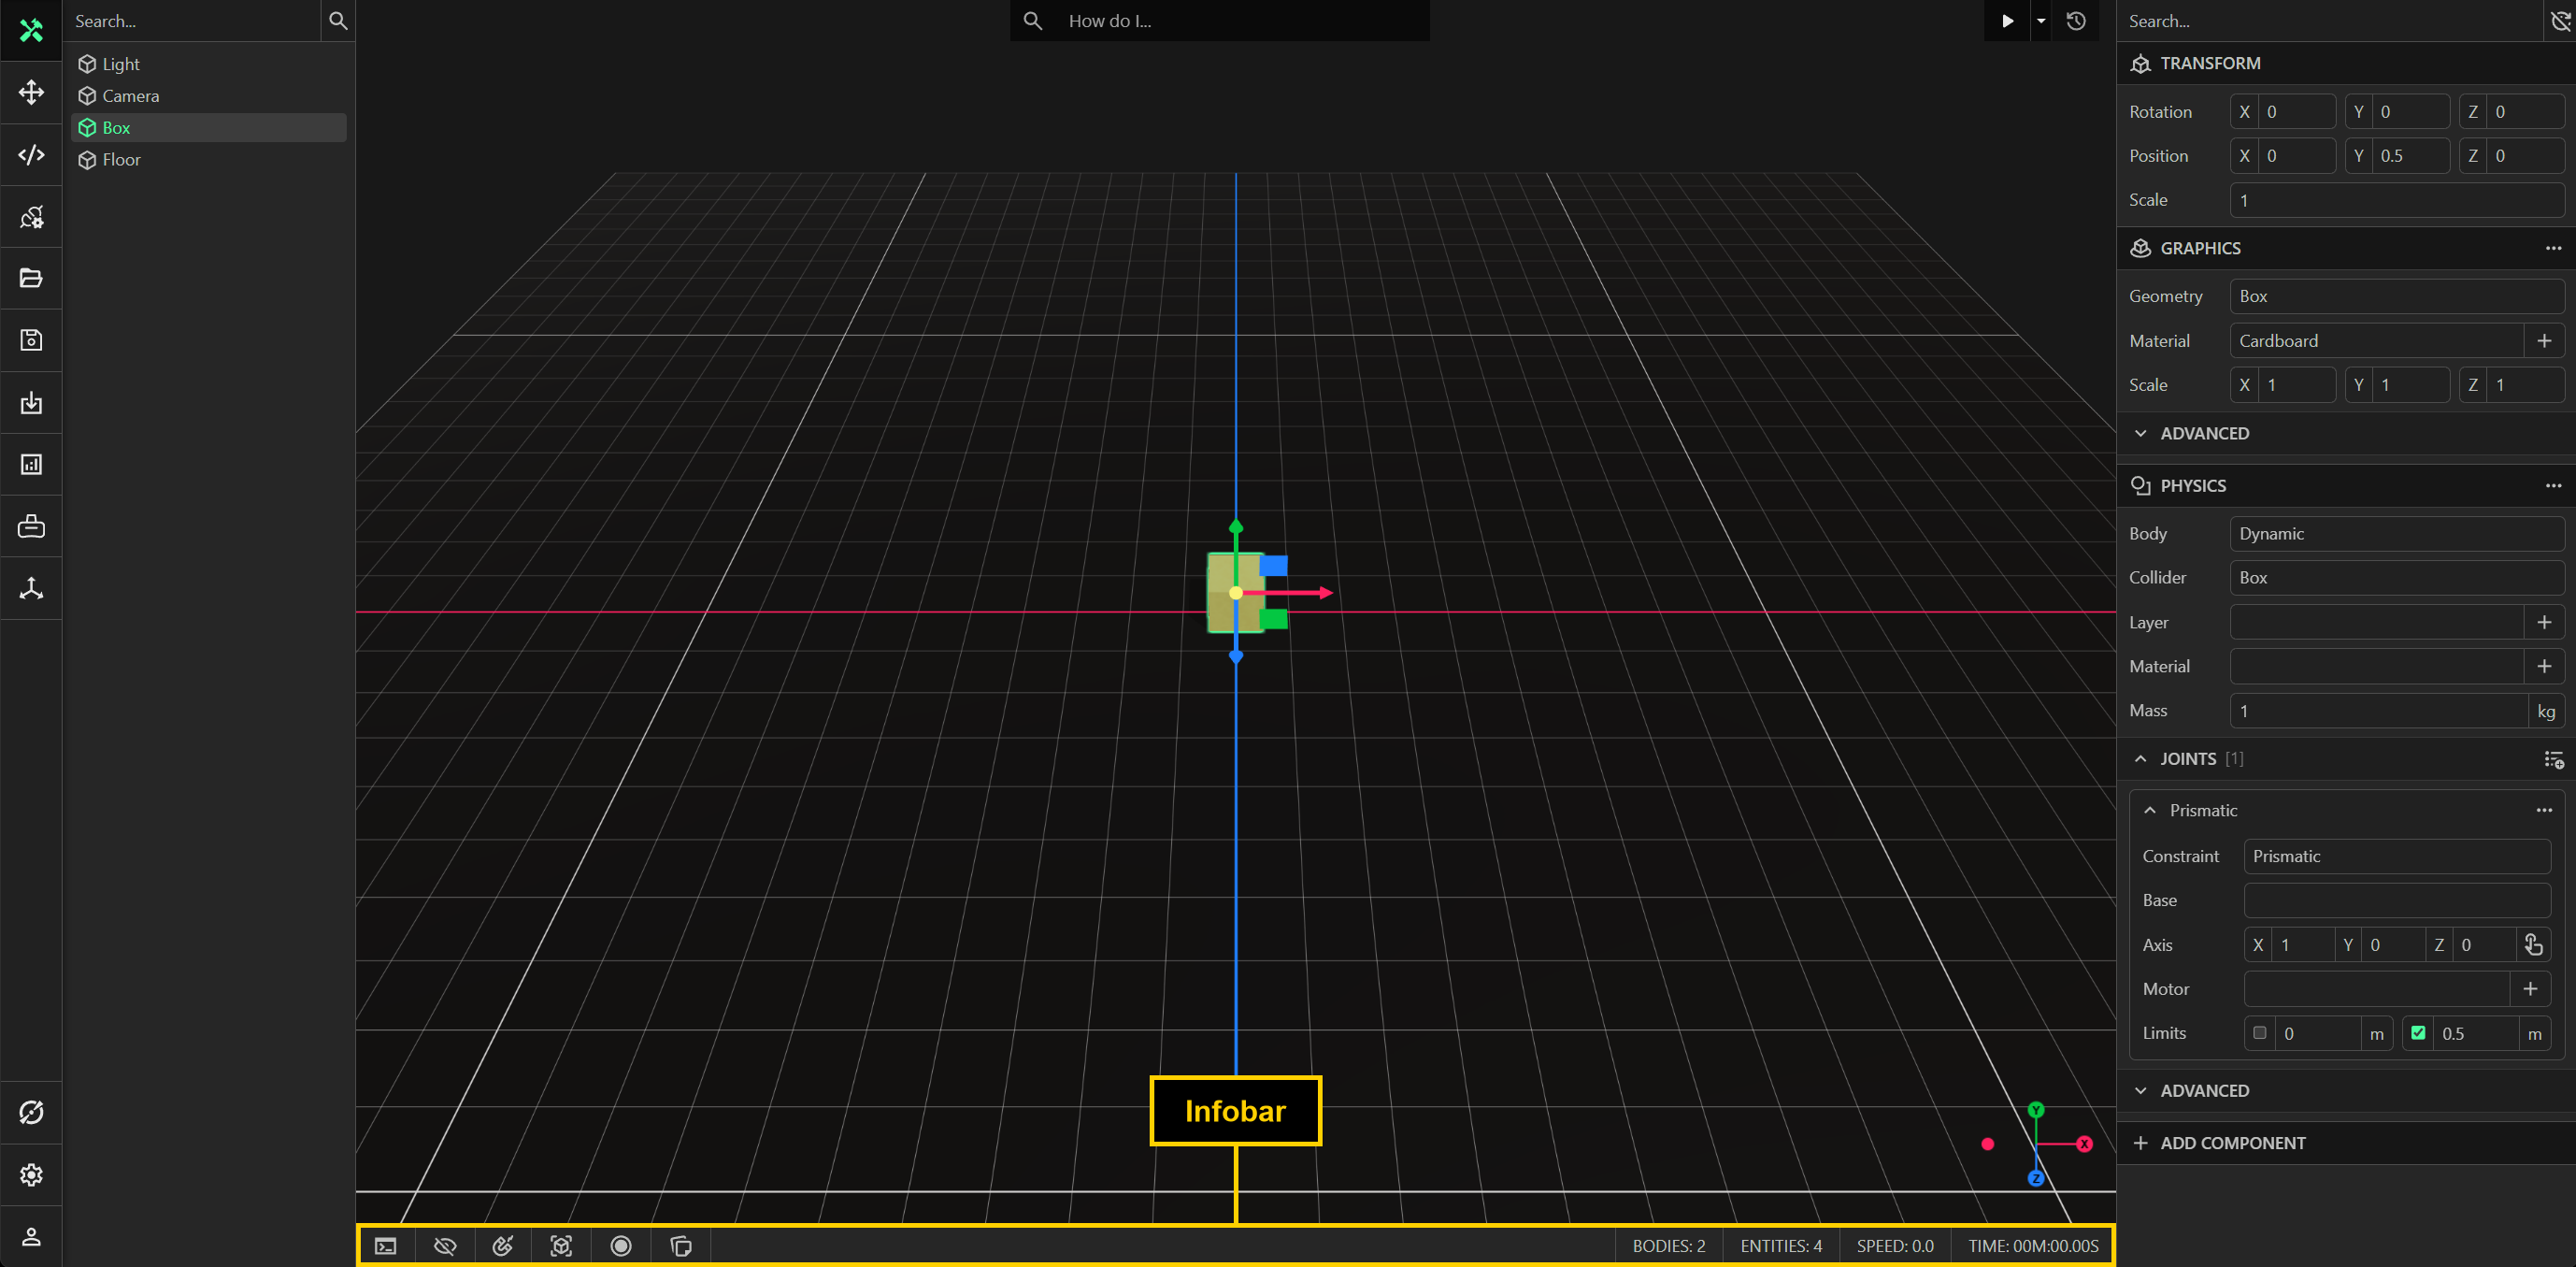
The infobar displays information about the content and progress of the simulation, including some buttons to toggle the console and other rendering modes.
Information
The information displayed includes:
- The number of rigid bodies currently alive in the model.
- The number of entities currently alive in the model.
- The current simulation speed, as a multiple of real-time.
- The current simulation time.
Console
The developer console displays errors and logs from scripts, such as console.error() or console.log() statements. Some built-in components, such as the physics component or the robot controller component, will sometimes output errors to the integrated developer console when an error occurs. User scripts outputting errors and logs are also displayed in the integrated developer console with a stack trace of the error or log.
Disable Rendering
The disable rendering button fully disables rendering, which can lead to improved performance when running models, but no visual changes when running models. This is particularly useful for collecting a large amount of data, or training AI models with RL using the Python API and the ProtoTwin Connect client.
Connectors
The show connectors button enables rendering the connectors, which you can use to visualize point and curve connectors. Click the button again to disable rendering the connectors.
Physics Visualization
The physics visualization button disables rendering graphics mesh geometry and enables rendering physics collision geometry. Click this button to toggle between rendering physics and graphics meshes.
Recording
The recording button opens a dialog window which supports the following two modes:
- Screen Capture: Records the window to a .webm video file.
- GLTF Frames: Records the simulation as a sequence of .gltf frames to a .zip file.
Notes
The notes button opens a dialog window where you can write a persistent text note to provide yourself or other co-workers with important context about your model. You can edit the text note at any time.