User Interface
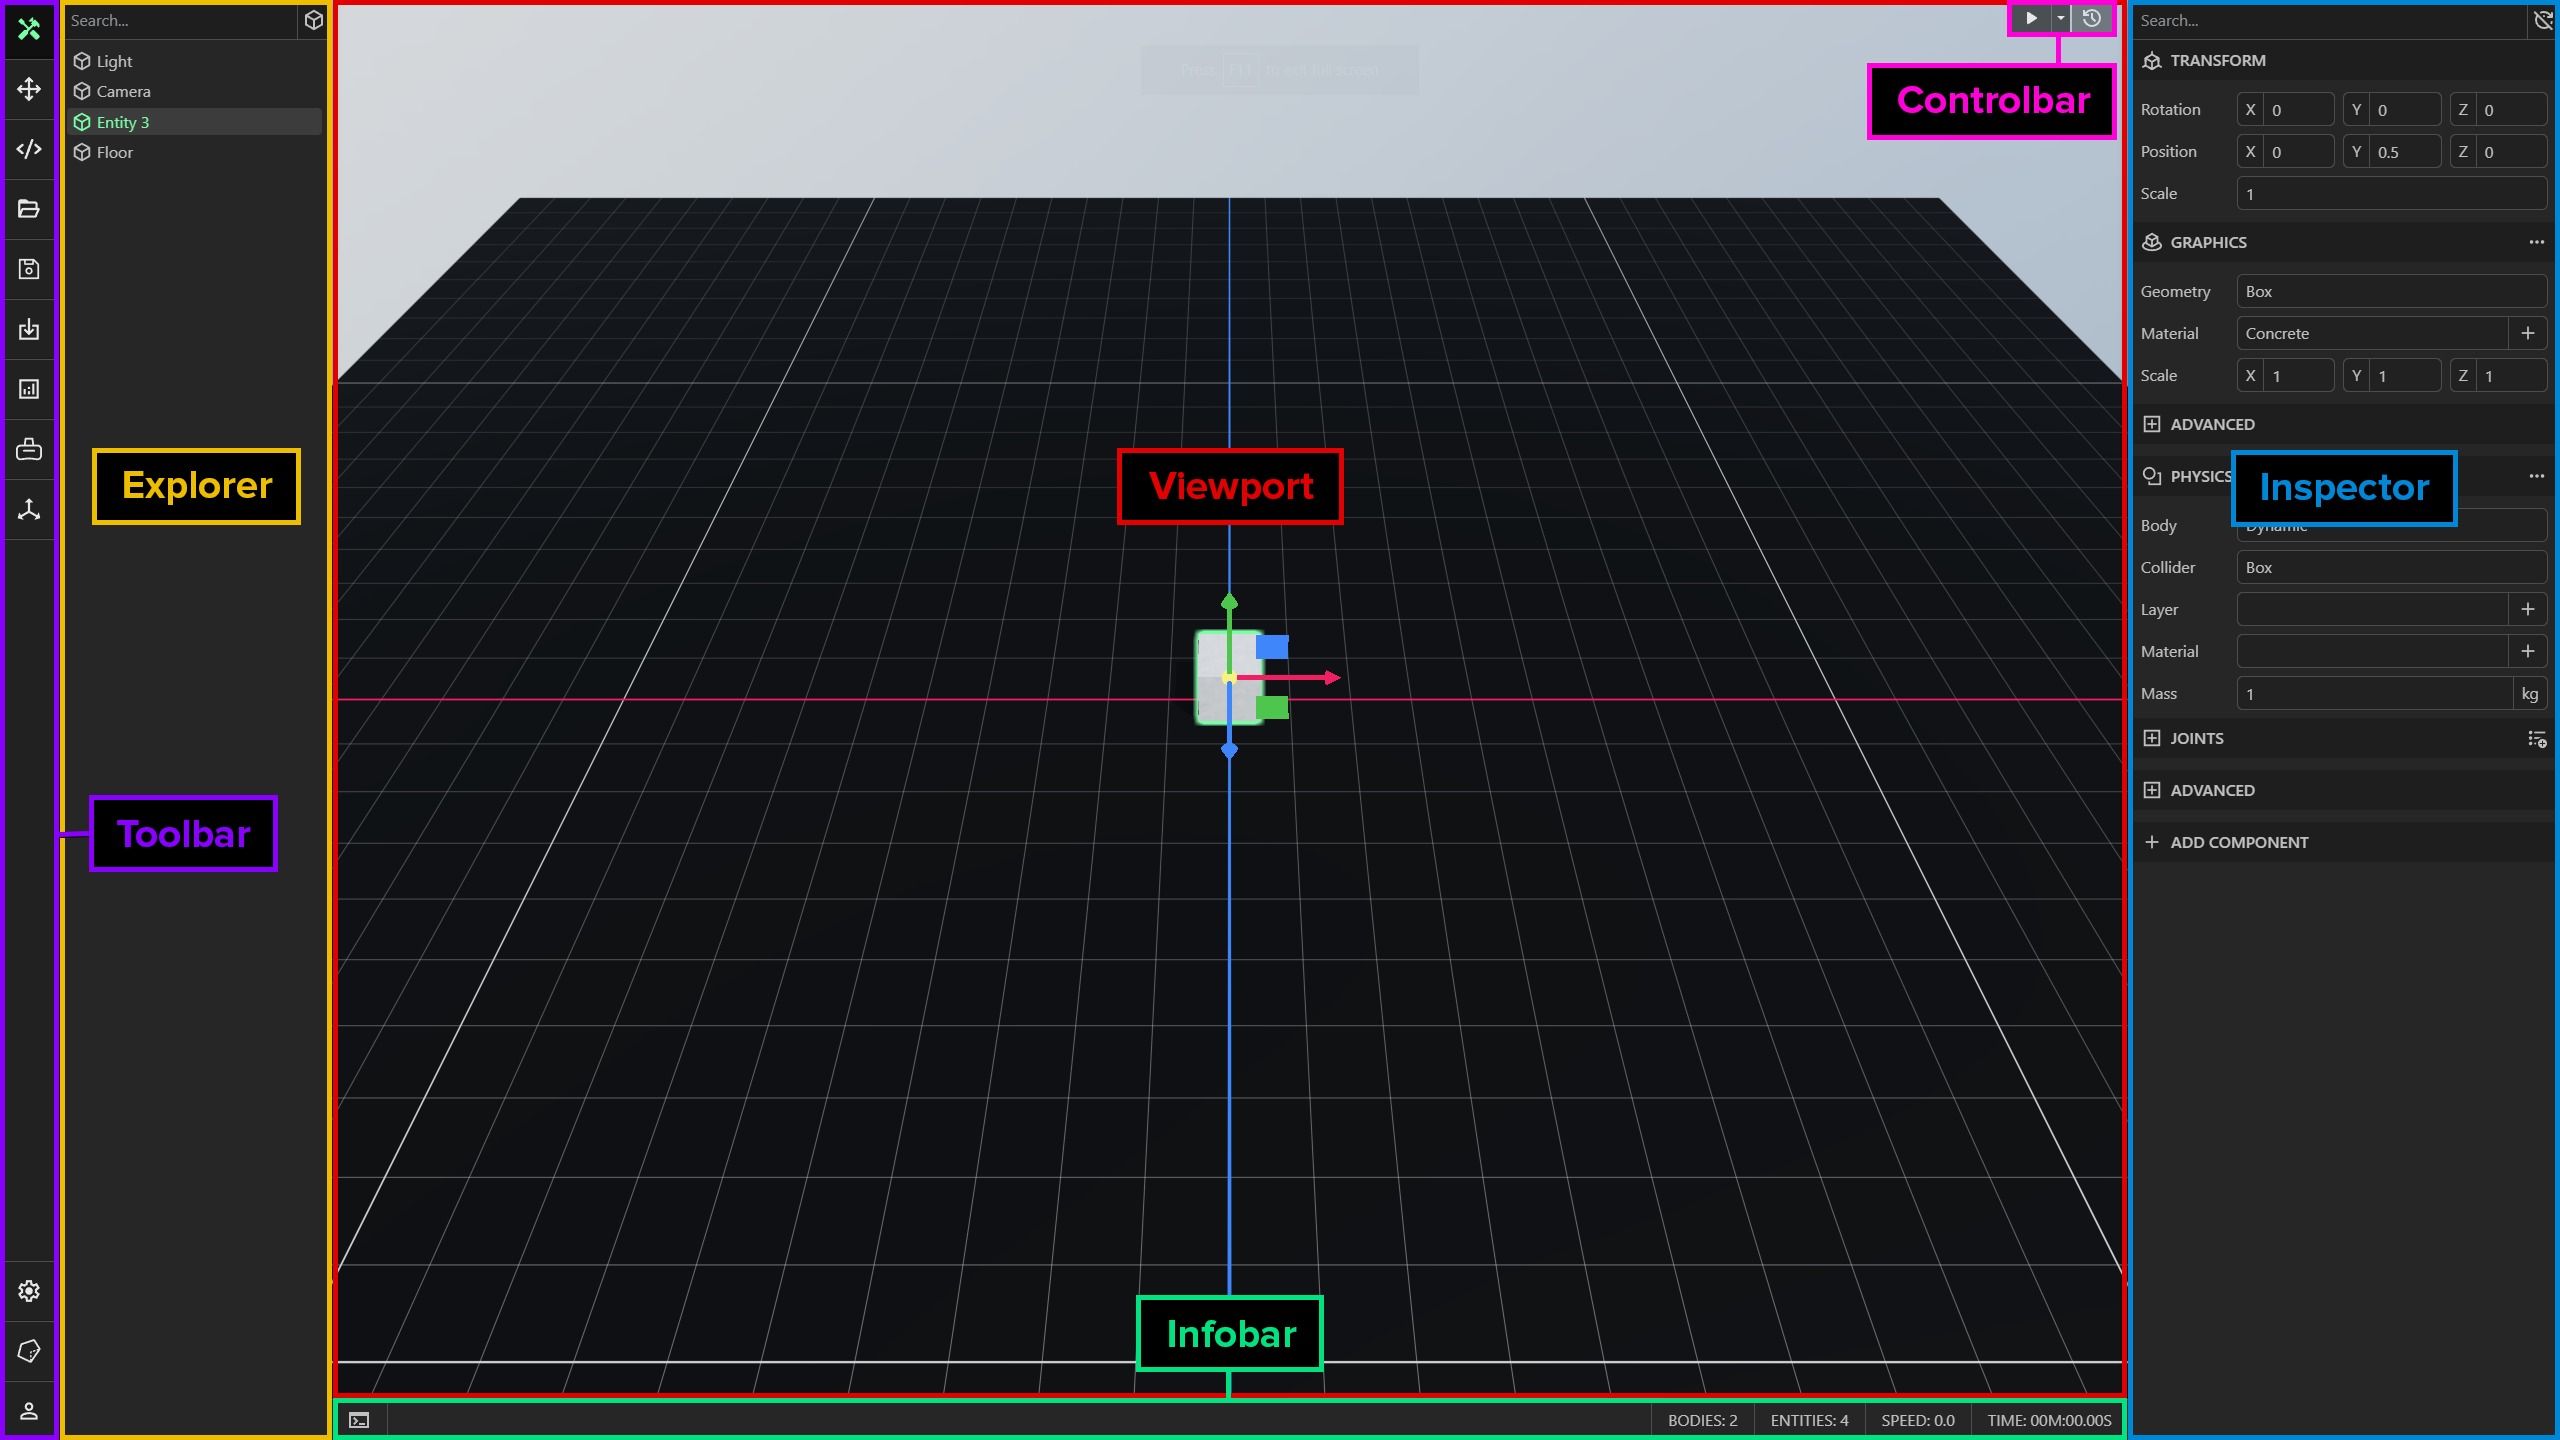
We’ve made great efforts to keep the user interface as simple and intuitive as possible. Please note that some parts of the UI may be missing depending on the product you are using. The user interface is split into 6 main parts: toolbar, explorer, inspector, viewport, controlbar and infobar.
You can navigate to any of these pages in the documentation below:
Toolbar
The toolbar, displayed to the far left of the screen, is a vertical set of buttons for switching between modes and performing common actions like opening a model, saving a model or changing the settings.
Explorer
The explorer pane, displayed just to the right of the toolbar, lists entities that are currently alive in the virtual world. You can select entities, rename entities, copy/paste entities, reparent entities, delete entities, create new entities, filter entities and group entities.
Inspector
The inspector pane, displayed to the far right of the screen, lists components added to the currently selected entity. It can be used to add, modify and remove components on the selected entity.
Viewport
The viewport displays the live 3D representation of the model from the perspective of the camera. You can orbit, dolly and pan the camera.
Controlbar
The controlbar, displayed in the top-right corner of the viewport, is a set of buttons for controlling the simulation. It can be used to start, pause and reset the simulation. You can also change the simulation speed.
Infobar
The infobar, displayed below the viewport, lists information about the content and progress of the simulation, as well as buttons for disabling the rendering, opening the developer console, toggling physics visualization and recording the scene as either a video or a sequence of GLTF frames.